Town Of Saratoga
Town Hall Survey Results
Background
The survey for the Saratoga Town Hall building has been tabulated and a summary of the results are reported.� The survey asked town residents to rate the importance of items in four areas:
1. Functions the Town Hall can serve, in addition to the normal town duties.
2. Type of construction � long-standing vs. a less costly limited structural building.
3. The consideration of a Green Building: a
new generation of buildings that maximizes both economic and environmental
performance.
4. The
location of the Town Hall within the town.
The purpose of the survey was to help the
Town Hall Building Committee answer questions about these areas in order to
have a Town Hall that meets resident�s needs and to inform the architect and
engineer in construction concerns like layout and structure.� On June 1, 2005 a total of 2,323 surveys
were sent to residents of the town and one hundred twenty four have been
returned by the Post Office as undeliverable.�
A total of 454 surveys have been received at Town Hall for analysis for
approximately 20% return.� The data from
the respondents was entered into the statistical analysis program SPSS and the
following information is based upon the examination of the respondent�s answers
on the survey.
Proposed Functions and Activities
There are
daily activities that are expected to take place in the Town Hall. �These include interactions with and between
the Town Clerk, Town Supervisor, Town Board, Town Court, Town Assessor, along
with Zoning and Planning Boards.� The
survey asked the residents about functions that would attempt to meet some
additional needs of town residents to aid in the design of the new building.� Below are many of the current activities that
are listed on the survey and the respondent was asked to rate the importance of
retaining the activity.� The rating
scale is (5) very important to (2) not important and an option of (1) for no
opinion.� It is important to note that
two items on the rating scale are reversed but this did not effect the
direction of the overall scale from high �Very Important� to low �Not Important�.� The following is a list of the activities in
order of importance from highest to lowest and the mean score associated with
the activity:
����������� Activity���������������������������������� Mean
1. State Police������������������������������������� 4.30
2. Community Meeting
Room�� 4.18
3. Senior Meal
Program����������������������� 4.03
4. Senior Center���������������������������������� 3.79
5. WIC program���������������������������������� 3.67
6. Youth
Activities������������������������������� 3.33
7. Probation���� ����������� ����������������������� 3.27
8. Honor Guard����������������������������������� 3.26
9. Adult Education������������������������������� 2.98
An item was also included for the
respondent to provide a suggestion for an activity they believed to be
important but was not included in the list.�
Thirty two percent of the respondents skipped the question and of the
remaining two-thirds (59%) indicated they did not have anything to add. �The primary suggestion of the ten percent of
the respondents that made a suggestion is to provide a space for voting during
the elections.
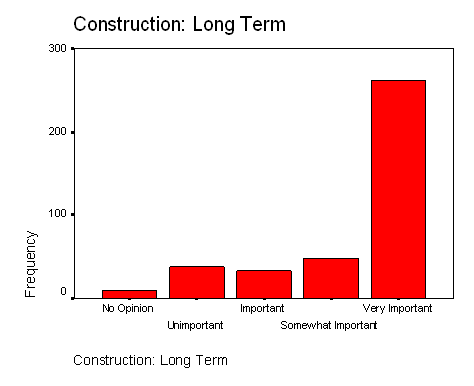
Type of
Construction
The survey asked the residents to rate the
importance of investing in durable, long-term construction compared to short-term
construction.� The present Town Hall is
modular construction and, though it is satisfactory, the building is certainly
showing wear after about thirty years of use.�
The survey noted for the residents that the cost for short-term construction
is lower. �The residents are asked to
rate (5 �Very important� to 2 �Unimportant�) the importance they placed on
having long term and short term duration of the building.� Sixty-seven percent (67%) of the respondents
said that long-term construction is very important compared to the ten percent
(10%) that identified short-term construction as very important.� The following bar chart illustrates the
residents support for long-term construction:
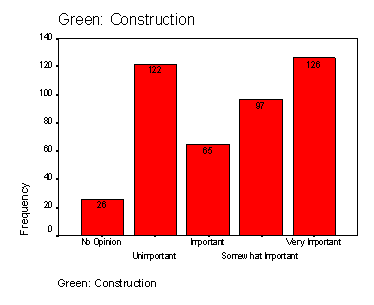
Environmental Design
The survey also asked the residents to consider making the new Town Hall environmentally efficient.� The survey identified this as a �green� building.� It seems the committee constructing the survey understood that the term �green� is used to refer to environmentally efficient, while many respondents were not sure what was being asked and some believe the survey was asking about the color of the building.� It will be important for the building committee to note that due to this confusion the residents are evenly split on this issue with twenty-nine percent (29%) indicating that a �green� building is �Very Important� while twenty-eight percent (28%) said that having a �green� building is �Unimportant�.� The following chart illustrates the split between the two items:
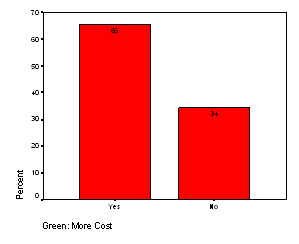
An interesting aspect of the issue regarding
a �green� building was when the residents indicated whether or not they were will
to pay more in construction costs for the building.� Two-thirds (66.6%) indicated that they are willing to take on the
extra cost for construction.� See the
following chart for a simple comparison of support for extra construction costs
compared to �no� to additional construction costs:
Location within the Town of Saratoga
Due to the
previous attempt to construct a new Town Hall, perhaps the most critical items
on the survey consider the location for the construction.� The previous attempt to have the residents
pass the referendum to construct a new Town Hall was challenged primarily on
the proposed location.� The location
would have been near the current Town Garage, which is close to Quaker Springs
and the referendum was twice defeated.�
Several locations were offered to the residents, starting with the
current location and expanding outside the villages of Schuylerville and
Victory and into the center of the Town.�
Following is the frequency of choices and the measure of central
clustering by the most frequent scale item chosen.
����������������������������������� Frequency������� Mean�������������� Mode
1. Current Location���������������� 362������������ 3.65����������������� 5
2. Within Villages������������������� 320������������ 3.08����������������� 2
3. Town Garage��������������������� 349������������ 3.36����������������� 2
4. Any location����������������������� 300������������ 2.86����������������� 2
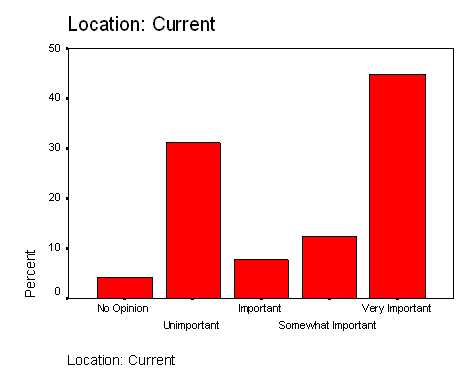
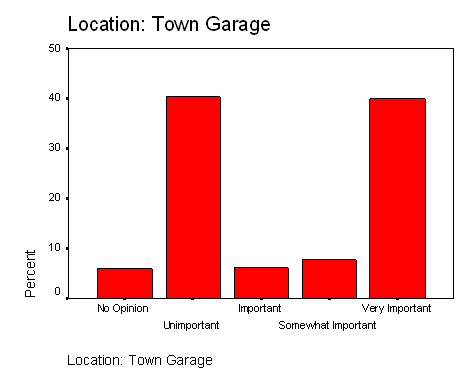
The highest frequency of votes is for the current location with the second highest for the area near the Town Garage.� It should be noted that respondents often voted for their favorite location and then did not respond to the other locations.� That is why there is a difference in the number of responses.� The primary example is the item for any location, 154 responses are missing.� This is a natural solution for identifying the item the respondents believe was most important, by indicating one and not responding to the remainder.� Two measures are provided to indicate where the majority can be found.� The first is the mean of the scale of 5 to 2 (1 is �No Opinion�). �The current location has the highest mean score with the second highest being the area near the Town Garage.� The second measure used is the mode which is the most frequent number on the scale chosen by the respondents.� The most frequent number for the current location is 5 � �Very Important�.� The most frequent chosen for the Town Garage is 2 � �Unimportant�.� Listed below is the frequency for the Current Location and the Town Garage and a bar chart of the scale.
Location: Current
|
|
|
Frequency |
Valid
Percent |
| Valid |
No
Opinion |
16 |
4.4 |
| |
Unimportant |
110 |
30.4 |
| |
Important |
26 |
7.2 |
| |
Somewhat
Important |
42 |
11.6 |
| |
Very
Important |
168 |
46.4 |
| |
Total |
362 |
100.0 |
| Missing |
Missing |
92 |
|
| Total |
|
454 |
|
Location: Town Garage
|
|
Frequency |
Valid
Percent |
| No
Opinion |
19 |
5.8 |
| Unimportant |
131 |
40.3 |
| Important |
20 |
6.2 |
| Somewhat
Important |
25 |
7.7 |
| Very
Important |
130 |
40.0 |
| Total |
325 |
100.0 |
| Missing |
98 |
|
| Total |
423 |
|
Demographic information about the residents is minimal but one item asked the location within the town that the resident lives.� Six areas were identified for the survey and the distribution of residents is displayed below:
Demographics: Residence Location
|
|
Frequency |
Valid
Percent |
| Quaker
Springs |
63 |
14.7 |
| Route
29 area |
66 |
15.4 |
| Saratoga
Lake |
60 |
14.0 |
| Schuylerville |
139 |
32.5 |
| Victory |
44 |
10.3 |
| Other |
56 |
13.1 |
| Total |
428 |
100.0 |
| Missing |
26 |
|
| Total |
454 |
|
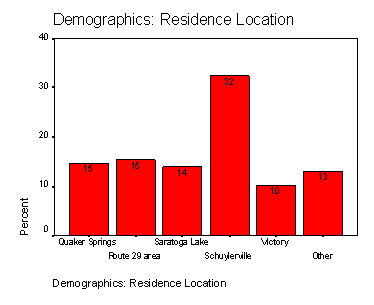
The majority of respondents, thirty two percent, come from the Village of Schuylerville and the remaining two-thirds are spread fairly even among the other areas of the town.
In closing, the question arises as to the validity of this survey and whether or not it is representative of the residents of the town.� The answer to both of these questions is yes.� Due to the huge response from the residents of the town, we have a sample that is large enough to in still confidence in the results of the survey.� This does not mean that we can predict how residents will cast their vote when it comes time to make a decision but we can provide the building committee and the developers with useful information upon with they can continue the planning process.